After thinking a bit about the comments made here and elsewhere about tube testers I decided to knock together my version of a relatively cheap but versatile tester.
My go-to tester has been the uTracer, mainly because it can provide the LTSpice models, but also it was relatively inexpensive.
However there are a few aspects of the uTracer that could be improved:
1. measurements are pulsed, so the tube never reaches operational temperatures;
2. it is relatively slow, multiple traces can take a long time;
3. it relies on being coupled to a computer running Windows 7 or lower (I am using a iMac in VirtualBox) so this limits flexibility/portability etc.
4. The GUI cannot be customised.
The classic tube tracer uses a rectified 50Hz voltage signal and an oscilloscope set in X-Y mode to provide Va-Ia/Is curves, so I adopted this method since it offers some advantages.
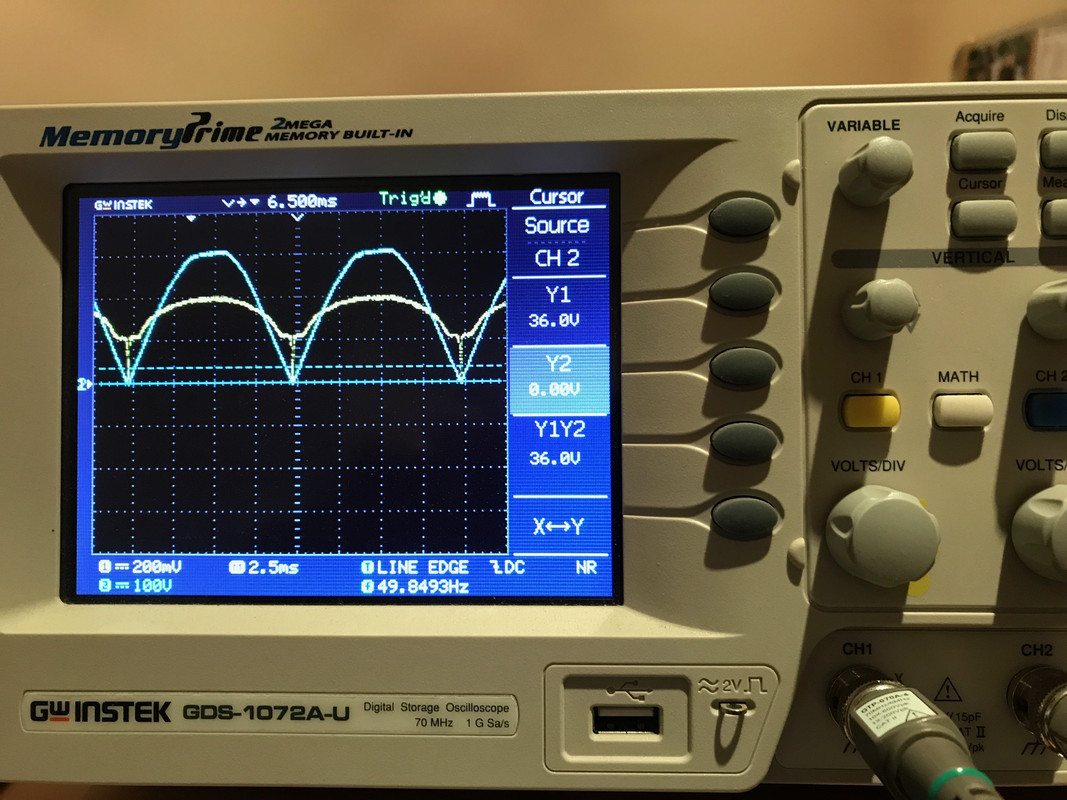
This picture shows Va (blue @ 100V/div) and Ia (yellow) traces
I decided to use a spare RaspberryPi 3B+ as a controller, with a Microchip PIC to do the 'grunt' work.
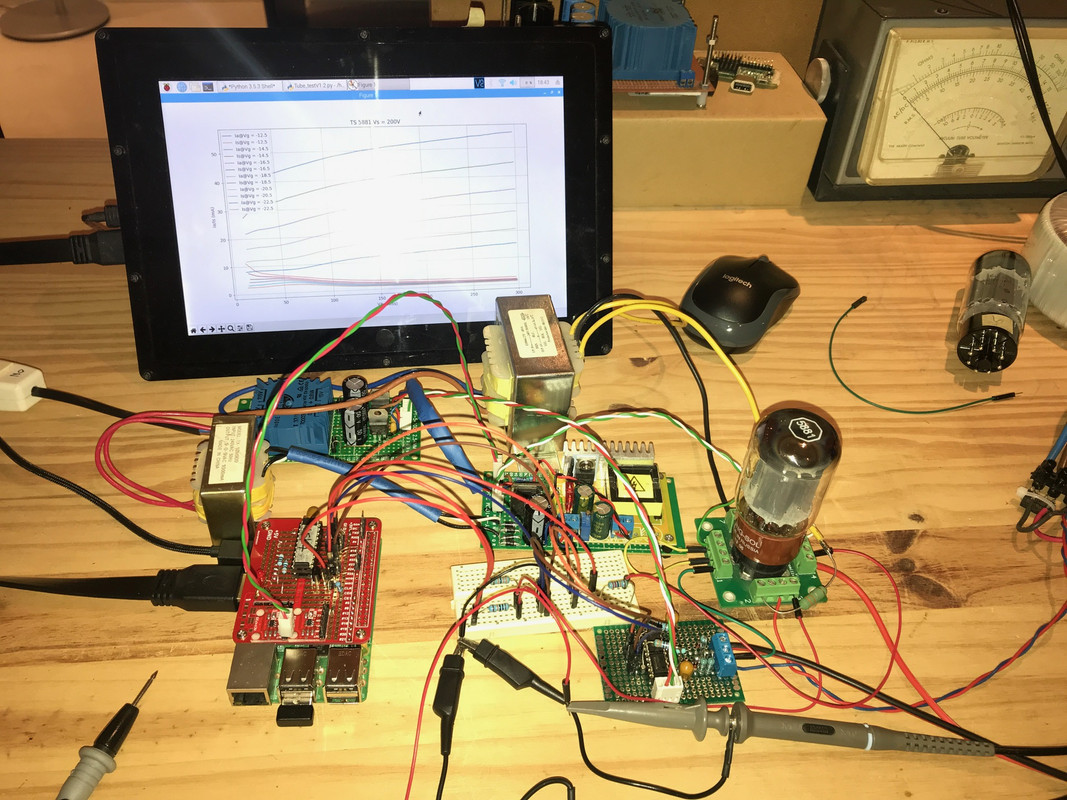
The RPi instructs the PIC to take a burst of measurements, starting at a sync pulse when Va = 0. The PIC ADC's take about 11us to do a single conversion, so it can take up to 65 measurements (x2 for Va & Ia) in a 1/4 of the mains cycle (5ms).
The RPi code is written in Python and the PIC code in C.
Since the current and voltage measurements are taken sequentially, I interpolate the current data points to get time alignment. Va/Ia curves and Va/Is curves are are taken from different 1/4 cycles.
Each sweep takes 5ms and I take 5 sweeps and average the results. The RPi controls Vg via a DAC and a simple grid voltage amplifier that gives a range of 0 to -100V.
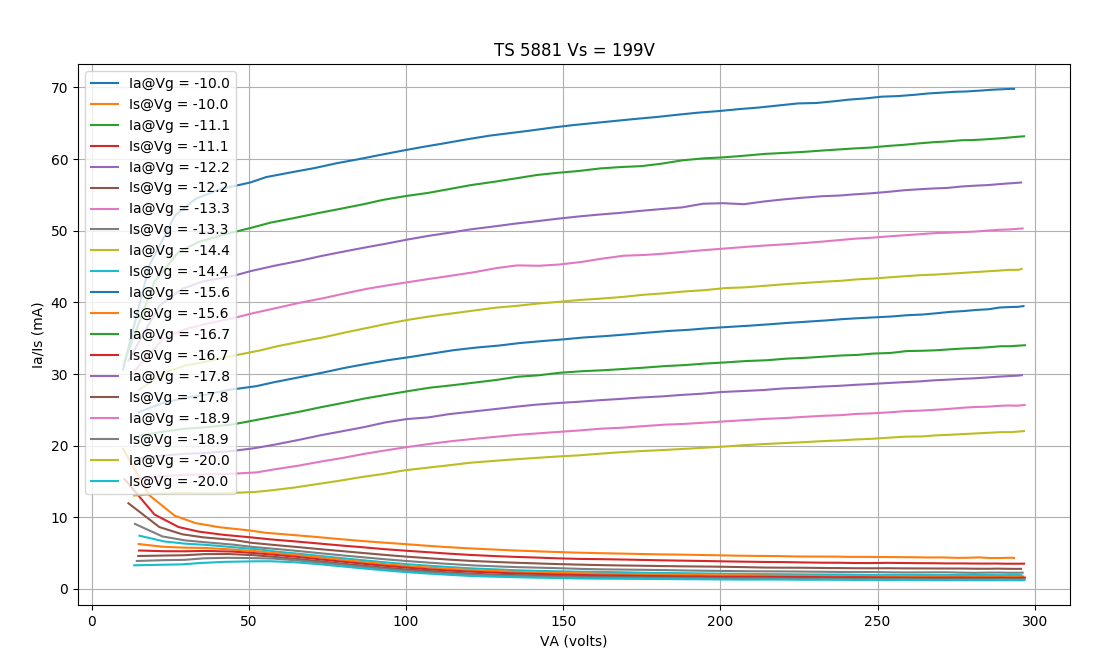
Python has many wonderful data manipulation and graphics functions so you can even plot a 3d version of the tube curves. This is a rather satisfying image!
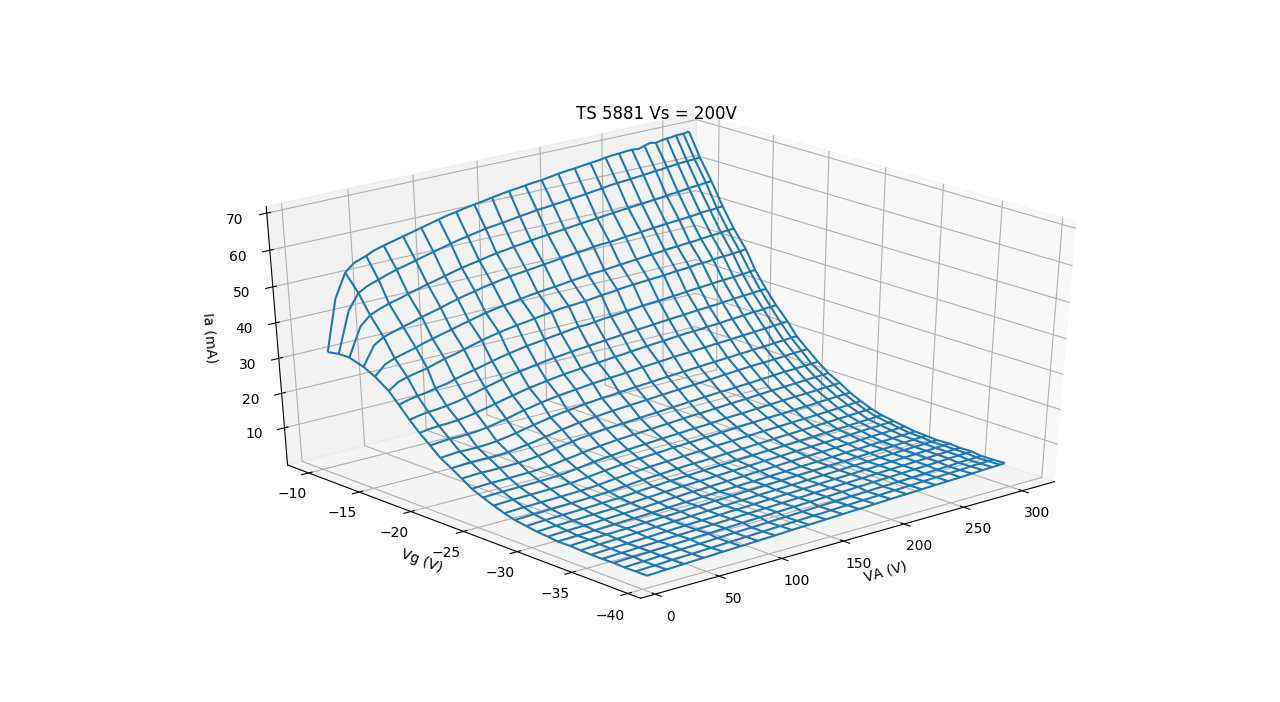
You can use the data to calculate all the usual small signal parameters at all the operating points, and with some effort (still working on this one) extract the LTSpice parameters.
I plan to build this into a briefcase style tester that should be compact and portable (still needs a mains connection). Things I still need to add is automate the Va & Vs voltage selection, and add variable current amplifier gain control.
Coming back to the original objectives:
1. this construction is cheap on basic hardware. The RPi & PIC and Vg supply is about R800. The Va transformer probably needs to be custom wound with a few taps to give voltage ranges of say 0-100,200,300,400V. Add RPi screen cost & other hardware.
2. it allows the tube to get to a 'normal' operating temperature (depending on your choice of bias)
3. It is fast. 40 traces takes 40s (excluding heating time)
4. The RPi makes it self contained.
5. Linux/Python makes the GUI infinitely customisable. (you actually do not need a GUI. This design does not need a keyboard or mouse, everything can ge set up via the small LCD screen and one encoder wheel. And a BIG RED button to start measurements)
My go-to tester has been the uTracer, mainly because it can provide the LTSpice models, but also it was relatively inexpensive.
However there are a few aspects of the uTracer that could be improved:
1. measurements are pulsed, so the tube never reaches operational temperatures;
2. it is relatively slow, multiple traces can take a long time;
3. it relies on being coupled to a computer running Windows 7 or lower (I am using a iMac in VirtualBox) so this limits flexibility/portability etc.
4. The GUI cannot be customised.
The classic tube tracer uses a rectified 50Hz voltage signal and an oscilloscope set in X-Y mode to provide Va-Ia/Is curves, so I adopted this method since it offers some advantages.
This picture shows Va (blue @ 100V/div) and Ia (yellow) traces

I decided to use a spare RaspberryPi 3B+ as a controller, with a Microchip PIC to do the 'grunt' work.

The RPi instructs the PIC to take a burst of measurements, starting at a sync pulse when Va = 0. The PIC ADC's take about 11us to do a single conversion, so it can take up to 65 measurements (x2 for Va & Ia) in a 1/4 of the mains cycle (5ms).
The RPi code is written in Python and the PIC code in C.
Since the current and voltage measurements are taken sequentially, I interpolate the current data points to get time alignment. Va/Ia curves and Va/Is curves are are taken from different 1/4 cycles.
Each sweep takes 5ms and I take 5 sweeps and average the results. The RPi controls Vg via a DAC and a simple grid voltage amplifier that gives a range of 0 to -100V.

Python has many wonderful data manipulation and graphics functions so you can even plot a 3d version of the tube curves. This is a rather satisfying image!

You can use the data to calculate all the usual small signal parameters at all the operating points, and with some effort (still working on this one) extract the LTSpice parameters.
I plan to build this into a briefcase style tester that should be compact and portable (still needs a mains connection). Things I still need to add is automate the Va & Vs voltage selection, and add variable current amplifier gain control.
Coming back to the original objectives:
1. this construction is cheap on basic hardware. The RPi & PIC and Vg supply is about R800. The Va transformer probably needs to be custom wound with a few taps to give voltage ranges of say 0-100,200,300,400V. Add RPi screen cost & other hardware.
2. it allows the tube to get to a 'normal' operating temperature (depending on your choice of bias)
3. It is fast. 40 traces takes 40s (excluding heating time)
4. The RPi makes it self contained.
5. Linux/Python makes the GUI infinitely customisable. (you actually do not need a GUI. This design does not need a keyboard or mouse, everything can ge set up via the small LCD screen and one encoder wheel. And a BIG RED button to start measurements)


