I stumbled across this recently.
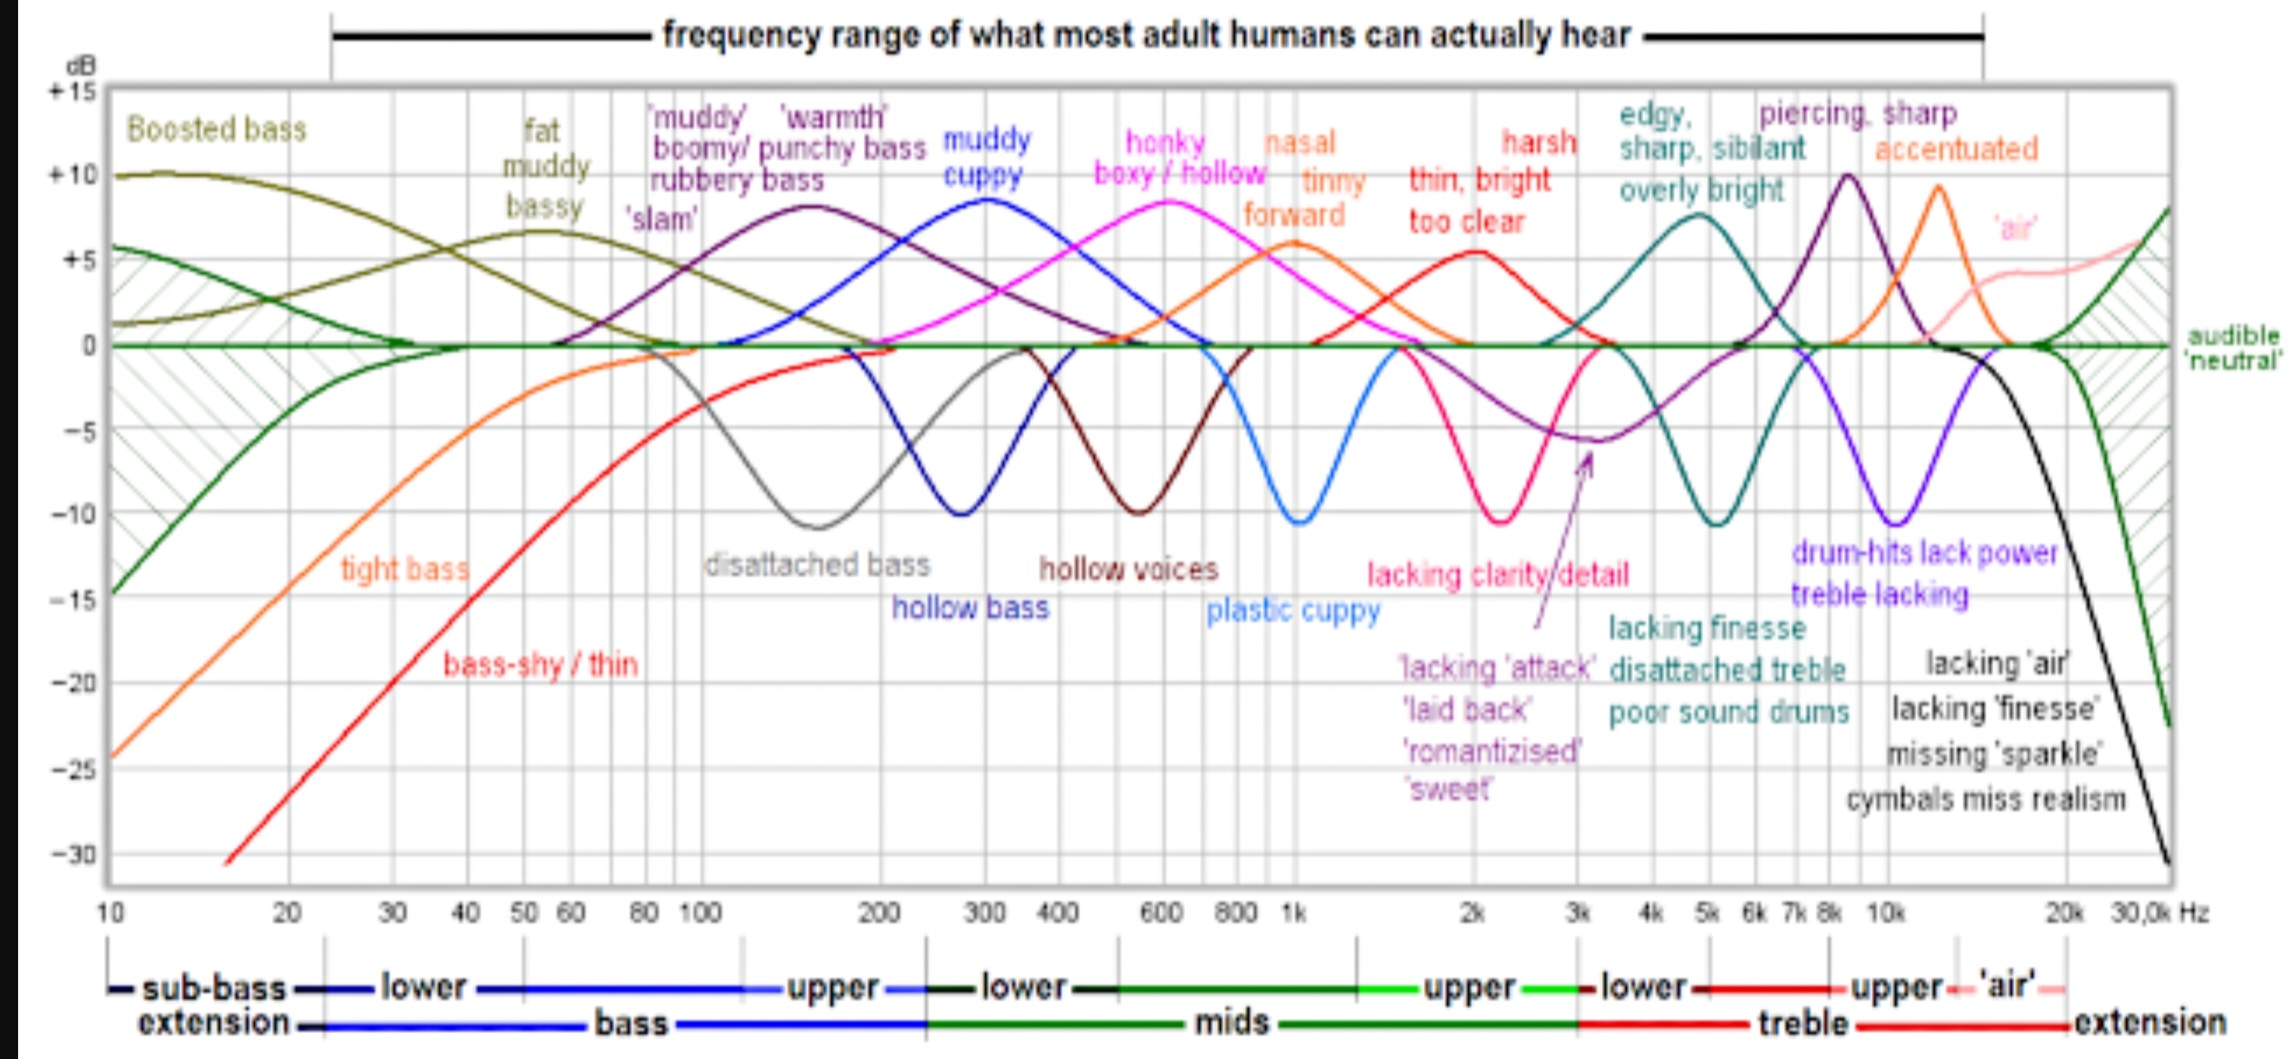
I know it is an oversimplification but attempts to identify how certain dips and elevations in a sound curve/ room response affects how you perceive the sound. So if your system lacks clarity as example, chances are that you have a dip around 2kHz. If you run REW and measure the room, you will be able to see if that is in fact so and if you have something like a miniDSP or other correction device, you can fix it.
I think this is quite a useful diagram and an easy to understand starting point for people wanting to attempt to analyse their room responses and interpret what they are seeing.